The Dashboard
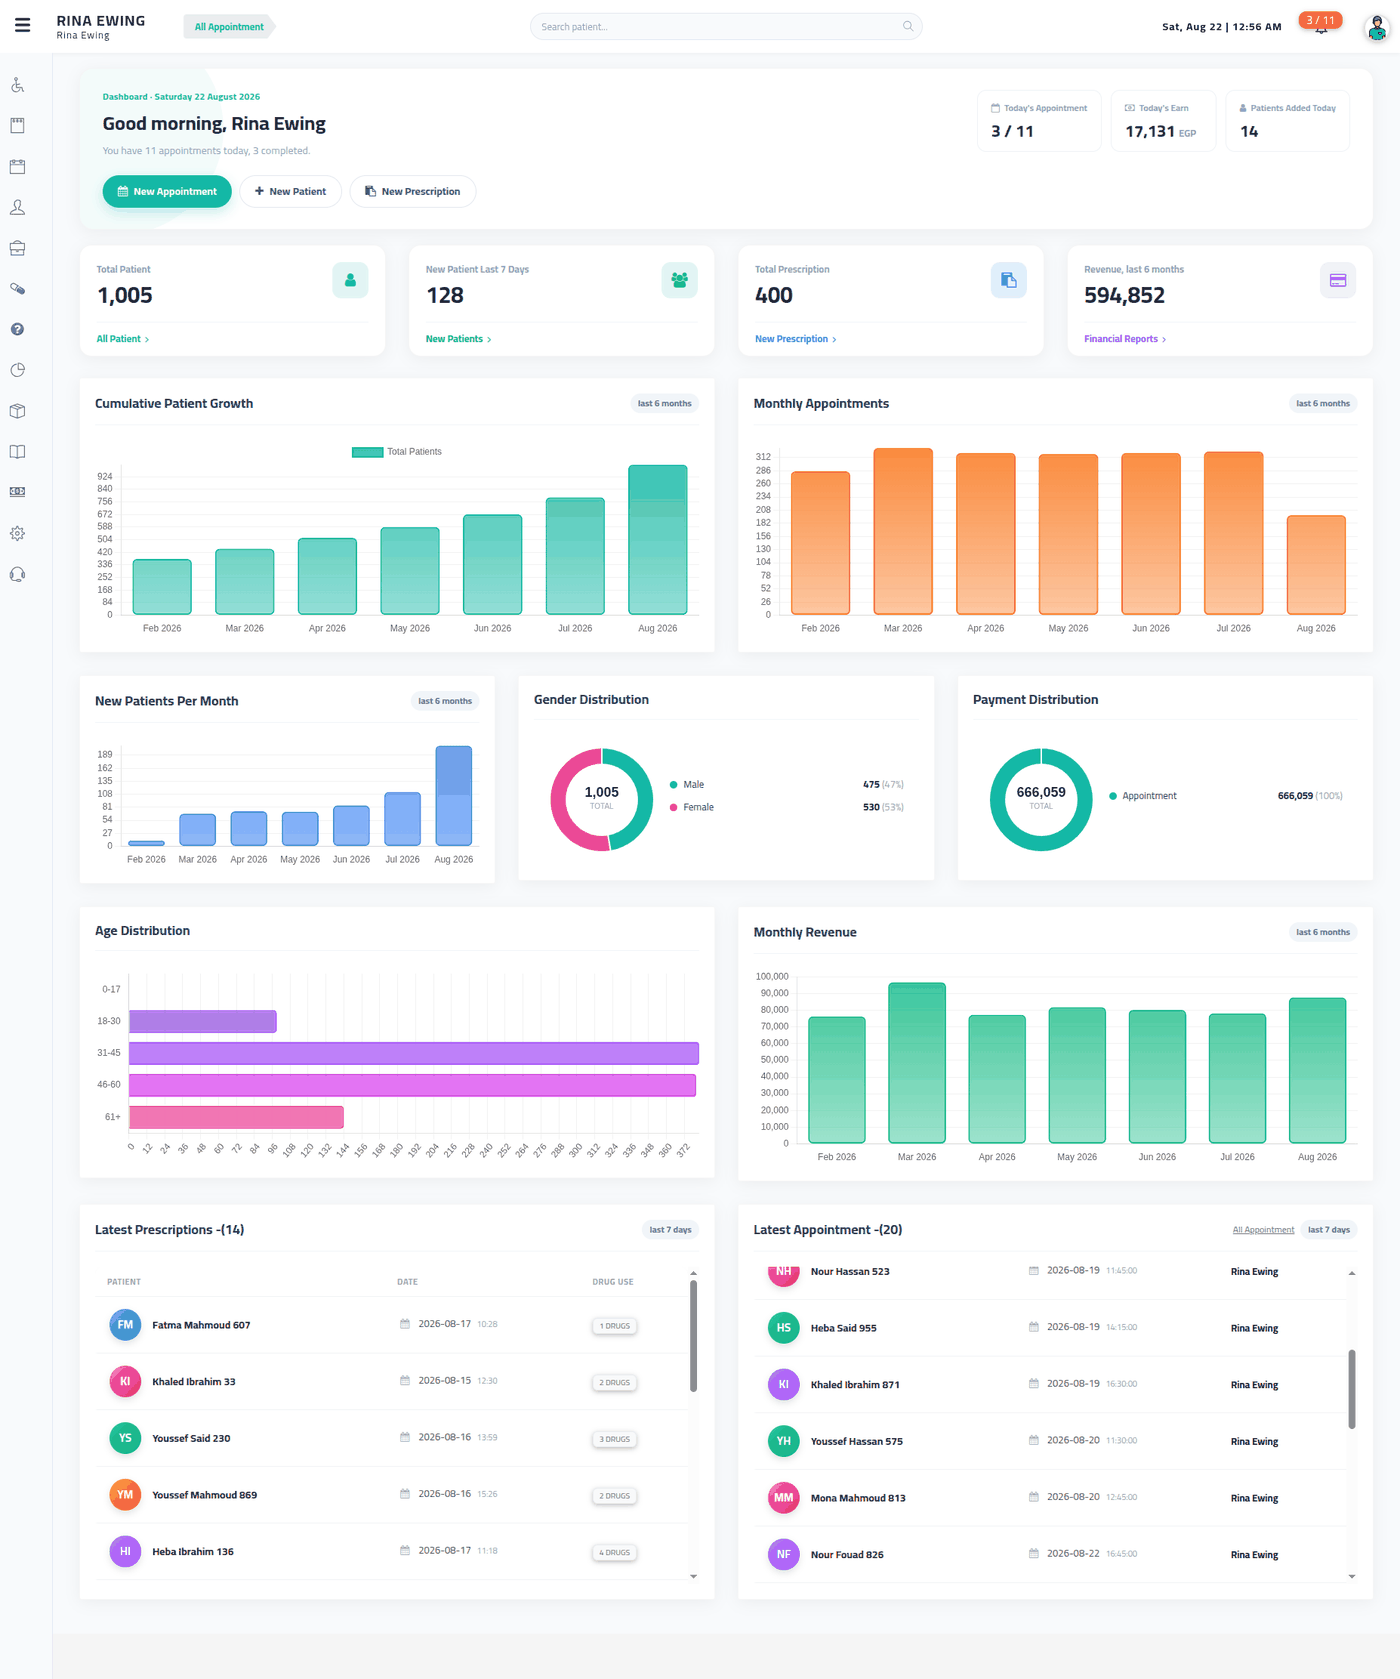
The first screen after signing in. It answers three questions: what is happening today, how is the clinic trending, and what happened in the last week.
What you see depends on your role — every card and chart is tied to a permission, and anything you are not allowed to see is simply absent rather than empty.
A doctor working in doctor mode lands on today's patients instead of this screen. The dashboard is still theirs to open; it is just no longer where signing in leaves them.
Where to Find It
Click an address to open that screen on your own clinic. The first click asks which clinic you are, then remembers it. Addresses holding a {id} or {token} need a specific record, so they are shown but not linked.
| Screen | Address |
|---|---|
| The dashboard | /home |
| Today's board, from the appointments chip | /appointment-today |
| Profit & Loss, from the revenue card | /profit-loss-report |
Today
The greeting line reports on the day: how many of today's appointments are finished out of the total, or that none are booked yet.
Three chips sit beside it:
| Chip | Shows |
|---|---|
| Today (appointments) | Done out of all appointments dated today — opens today's board |
| Today (earnings) | Everything received today, in your currency |
| Patients Added Today | New registrations today |
Three quick actions cover most of what staff do on arrival: New Appointment, New Patient, New Prescription.
The Four Cards
| Card | Shows |
|---|---|
| Total Patient | Every patient on file |
| New Patient Last 7 Days | Registrations this week |
| Total Prescription | Prescriptions ever written |
| Revenue, last 6 months | Payments received over the last six months — links to Profit & Loss |
The Charts
Seven charts, all over a six-month window:
- Cumulative Patient Growth — the size of your patient base over time
- Monthly Appointments — volume per month
- New Patients Per Month — how fast the base is growing
- Gender Distribution and Age Distribution — who your patients are
- Monthly Revenue — income per month
- Payment Distribution
WARNING
Payment Distribution is not cash versus card. It splits money by where it came from — Appointment or Physio Session. For a breakdown by payment method, read the Cash Flow report.
Last Week
Two live tables close the page: Latest Prescriptions (with the number of drugs on each) and Latest Appointment (with who booked it), both covering the last seven days.
Which Branch These Figures Cover
With a second location open, the money figures on this page follow the branch you are working in — the one named in the switcher at the top of the screen — and say so beside the label. Switch branch and the same tiles show that branch's day.
You are always working in exactly one branch — there is no whole-practice mode in the switcher, because every record you create has to belong somewhere. For the practice added together, use the branch filter on the reports, where All branches is one of the choices.
Patient and appointment counts follow the same rule as the money.
Why Two People See Different Dashboards
| Missing permission | What disappears |
|---|---|
| View Patients | Both patient cards and the "Patients Added Today" chip |
| View Prescriptions | The prescription card |
| Any appointment permission | The today's-appointments chip; the greeting falls back to a plain welcome |
| View Reports | The revenue card, all seven charts, and both "last week" tables |
That last row is the one to think about when you build roles: View Reports is effectively "sees the clinic's money on the dashboard". A receptionist who should book and take payments but not see revenue needs everything except that permission — see Staff and Roles.